Business Activity Analytics (BAA) Overview
Help customers manage and monitor their business strategically
Business Activity Analytics is a new way to manage for business customers to protect their properties using their business cameras. By creating and using rules around movement or group gatherings, business owners can transform the way they protect their business. They can also schedule reports that aggregate daily, weekly or monthly data to gather information and make informed decisions.

OCCUPANCY + PEOPLE COUNTING
Draw a tripwire at the entrance to a location to determine total net occupancy at any given time with multi-directional counting
Receive notifications when occupancy is too high

PEOPLE COUNTING
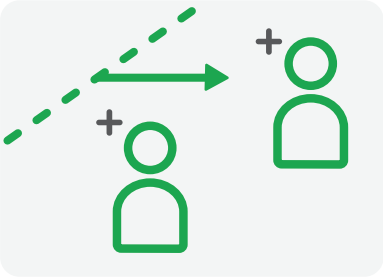
Draw a tripwire anywhere within the property to count how many people cross that invisible line in one direction

HEAT MAPPING
Draw a ground zone to track and visualize where people spend the most time within an area during a specified date and time range
Review a time lapse or single image heat map of a defined area. Visualize changes over time or visualize the average movement in an area

CROWD GATHERING
Draw a ground zone and count how many people are in a defined area at any given point
Receive immediate alerts when too many people gather in the defined area

QUEUE MONITORING
Draw a ground zone to count how many people are in a defined area and measure their average wait time
Receive notifications when the queue length or average wait time exceeds a preset limit and deemed too long
COMPATIBLE CAMERAS
Alarm.com Wi-Fi Cameras
- ADC-V523/523X
- ADC-V723/723X
- ADC-V724/724X
Alarm.com PoE Pro Series Cameras
- ADC-VC727P
- ADC-VC827P
- ADC-VC847PF
- ADC-VC728PF
- ADC-VC838PF
- ADC-V729/V729AC/VC729P
SERVICE PACKAGE REQUIREMENTS
- Commercial Video 4/8/16, Commercial Video or Commercial Video Plus
- Business Activity Analytics add-on
BAA scenarios
| Scenario | Setup | Insight | Action |
|---|---|---|---|
|
Retail Shop John just installed a new product display and wants to know if it is effective at attracting customers |
He creates a heat mapping rule to see if people spend time at the display |
After a week, the heat map shows about the same foot traffic activity around the new display as the previous week |
John updates the display with new imagery to capture attention and increase sales |
|
Grocery Store Sara oversees 12 checkout lanes while also receiving the daily deliveries at the delivery dock and training new employees |
She creates queue monitoring rules to consistently measure the length of each line and wait time duration |
A sudden influx of customers are now standing in line and she receives a notification that their wait time is too long |
Sara quickly opens another two lanes and reduces line length and wait times |
|
Health Clinic Emma is managing a healthcare clinic that hosts walk-in hours from 1pm-4pm each weekday |
She creates a crowd gathering rule to run between the hours of 1pm-4pm in the walk-in clinic area so she can ensure regulatory compliance of safe social distancing |
Multiple people arrive and stand in the clinic’s lobby causing a crowd to gather. This sends an automatic mobile notification to Emma that too many people are gathered in the defined space |
Emma sends her administrator to the lobby to guide people to wait outside the lobby in a socially distanced line |
|
Event Space Anthony is working behind the scenes at a local concert hall on a busy Friday night in preparation for a popular music group |
Before the venue opens, he enables the occupancy + people counting rule to help his team adhere to the venue’s fire code max capacity limit |
As the show starts and people are settling into their seats, the venue’s event coordinator checks in to see if everything is going smoothly |
Anthony pulls out his Alarm.com mobile app to show the coordinator they are under capacity by 2% and confirms that they are adhering to fire code guidelines |


